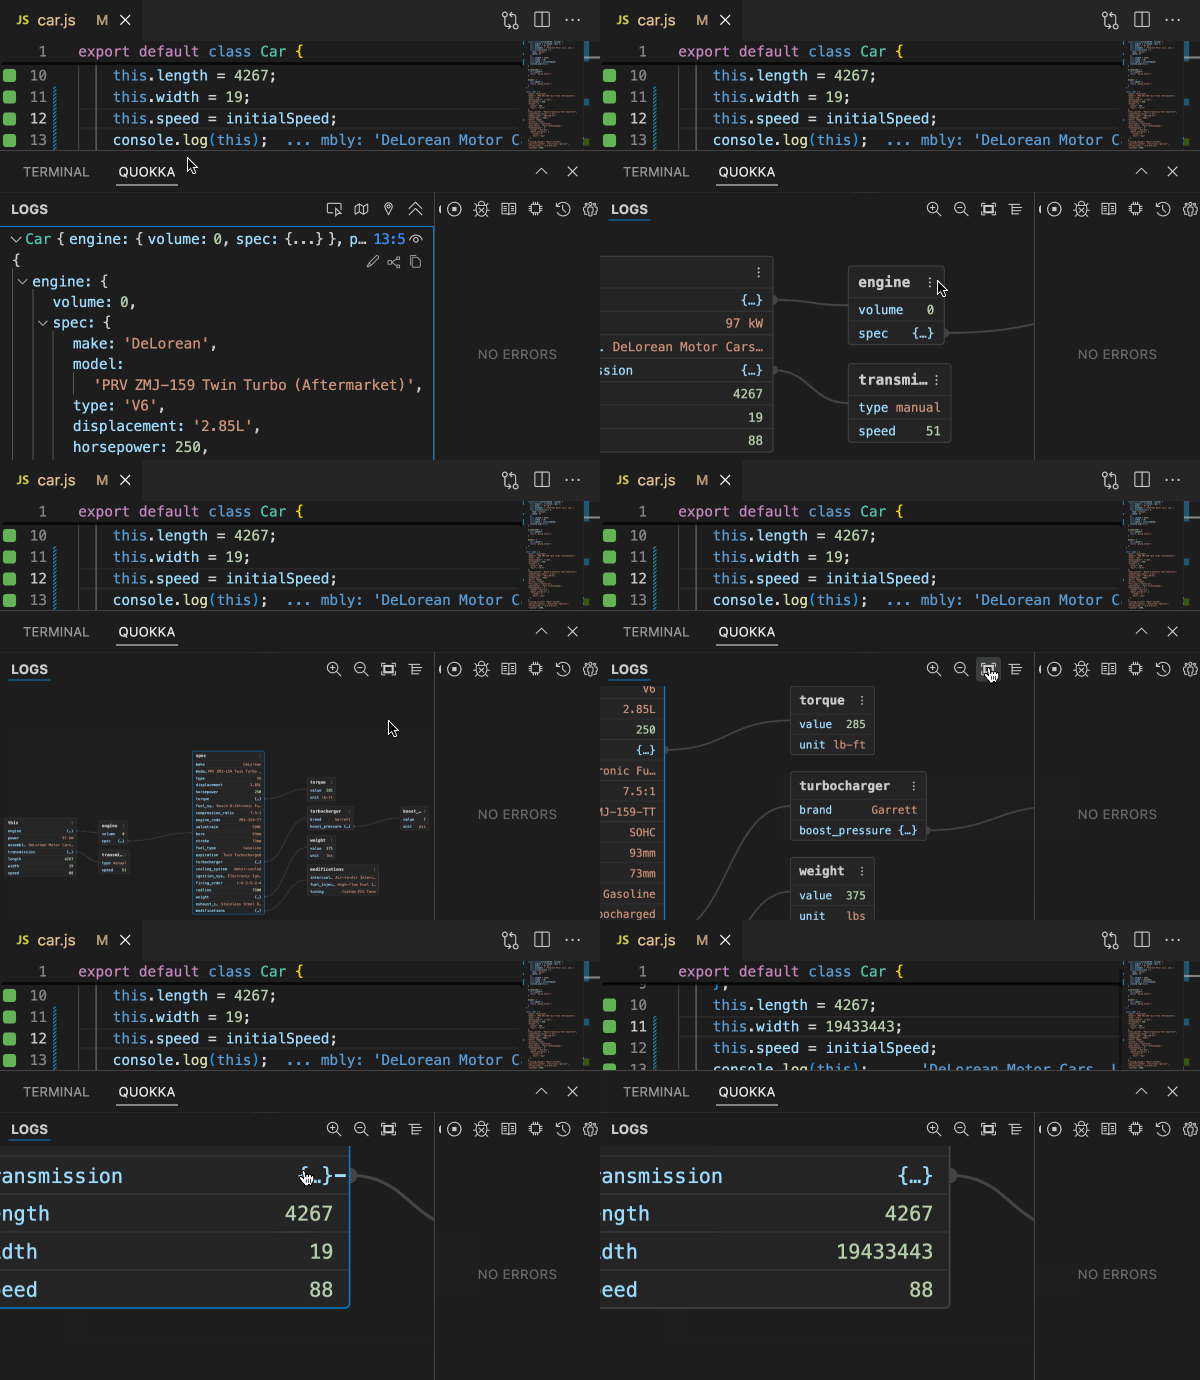
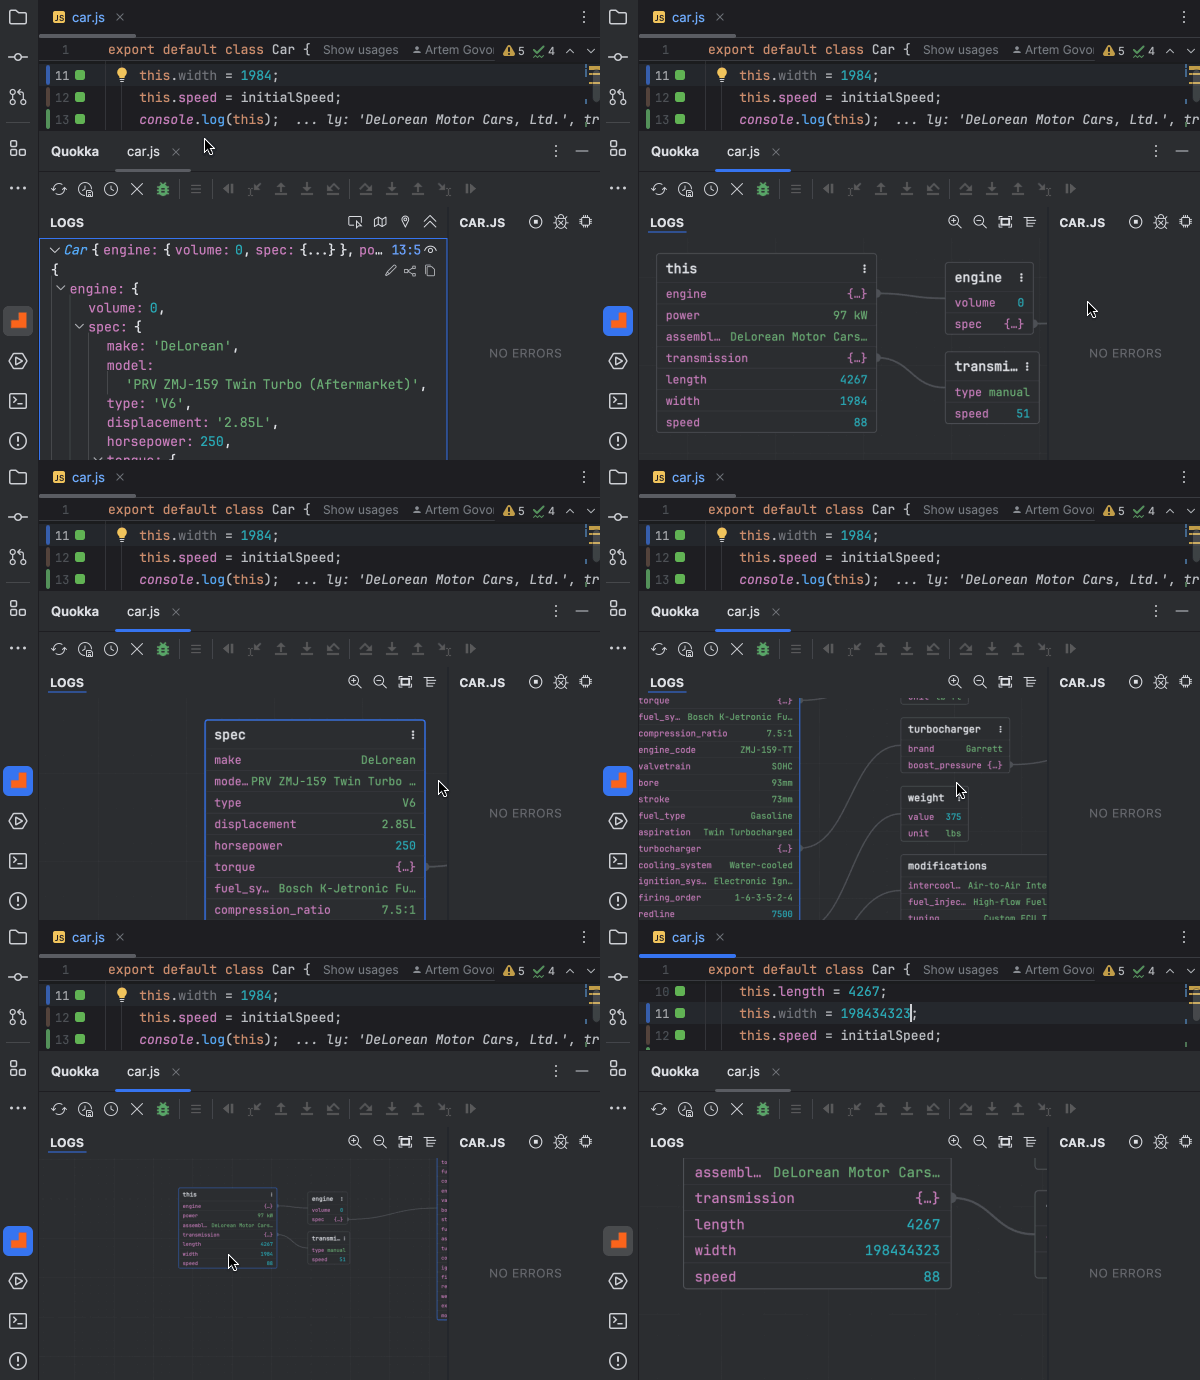
Interactive Runtime Value Graphs
The new Interactive Runtime Value Graphs feature lets you visualize runtime data as structured graphs directly in your editor. It’s useful for inspecting deeply nested objects or large data sets that are hard to parse in raw text form. The graph layout adapts well to various data shapes, and you can interactively collapse or expand branches and nodes to focus on the parts that matter. The graph updates automatically as values change, giving you a live view of your log’s state.

